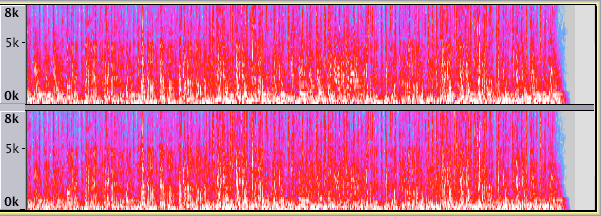
Spectrogram View at Audacity: A spectrogram is a device that helps capture the intensity of sound waves. This unique technology helps in the capture of different energies belonging to the different frequencies; thus, it reaches the highs and lows.
- Sponsored Links -
Smearing: types
The smearing in spectrograms includes the comparison for the frequency over time. This variety has two types:
- If you want to use can use time smearing, you must have a small window size.
- And, if you want to work with a large size window you must choose Frequency smearing.
Open your windows
The window here indicates the visual capture of leakage from the spectral. Usually, the band uses the frequency that enables a person to view in a smaller spectral span, leading to leakage in its actual spectre. Usually, it is a 2.0K mark. This is typical in Hann Window type.
However, in order to protect this leakage, there also exists another visual capture called the Blackman-Harris Window Type. This captures the spectre and gives a wider spectral image.
The Zero Factor
This factor helps in determining the internal spreading of colors. This is imperative to the spectrogram working. The interpolation turns finer at the cost of time. And moreover, the zero factors at 1 tune to a finer interpolation, while the interpolation at 8 has a hazier effect.
The Log view
The logarithmic view will help in a concise view of the linear sequence of overtones. Thus, in a sequence that captures the linear flow of musical overtones, a logarithmic view will give a concise picture. It is like zooming in the picture of one of the frequencies.
Period view
This scale is best used with the “Pitch (EAC)” algorithm. If you want to compare with other scales, small period values must be placed at the top, while the bigger ones must be placed at the bottom. This scale tends to give a representation of pitch, but the scale of logarithm makes the representation of the pitch better. Therefore, it is better if you choose the logarithmic scale.

You can also work with the settings of the tune to build good audio. Spectrogram forms an integral part of building audio. While you work with spectrogram, you will be able to find minimum and maximum settings. They are nothing but the representation of the maximum and minimum frequencies.
You must also be aware of the range settings. Colors such as white, red, magenta, dark blue, light blue and grey are a representation of Range settings. They determine the spacing between colors, facilitating the proper working of the spectrogram.
Selecting the Spectral
The selection depends on the proper and correct frequency and time range as desired. If you want to reach the desired decision, one must have access to these settings.
So, you can simply work with these settings to ensure proper utilization of Spectrogram to create awesome audio. If you want to work with a spectrogram, you must use these settings to perfection to ensure the development of perfect audio. Click here to learn more.
Read more articles.
- Dithering Effect Of Audacity Right Here
- Distortion: Introduction, types, and usage
- How to use the Directories preferences?
- Spectrogram View at Audacity


